Data analysis and visualization to bring awareness around the power consumption at ITP
A set of tools to inspect the energy consumption at the Interactive Telecommunications department at NYU.
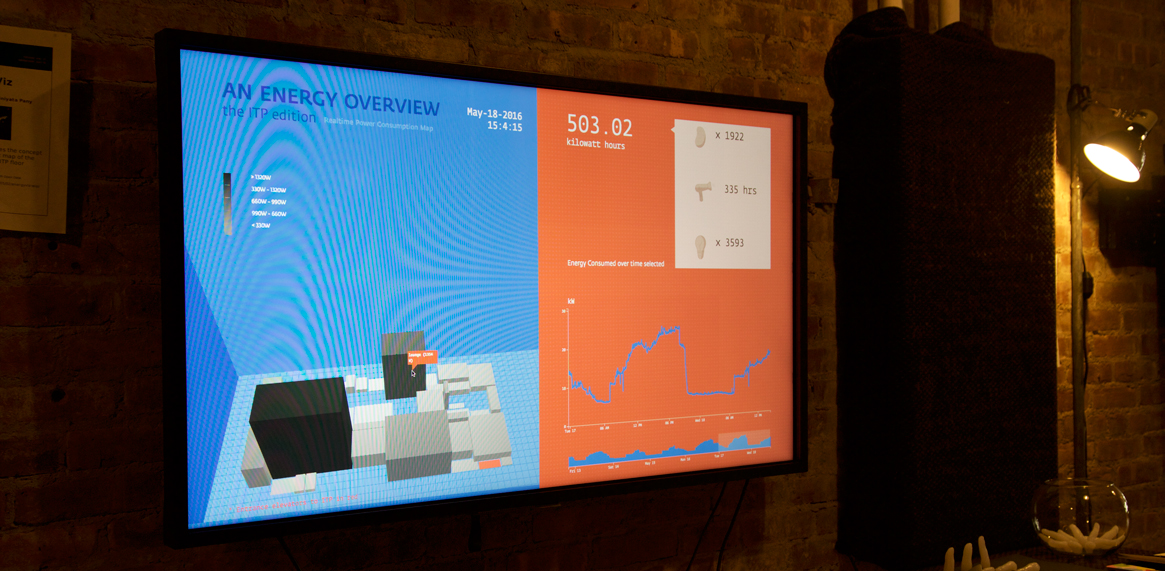
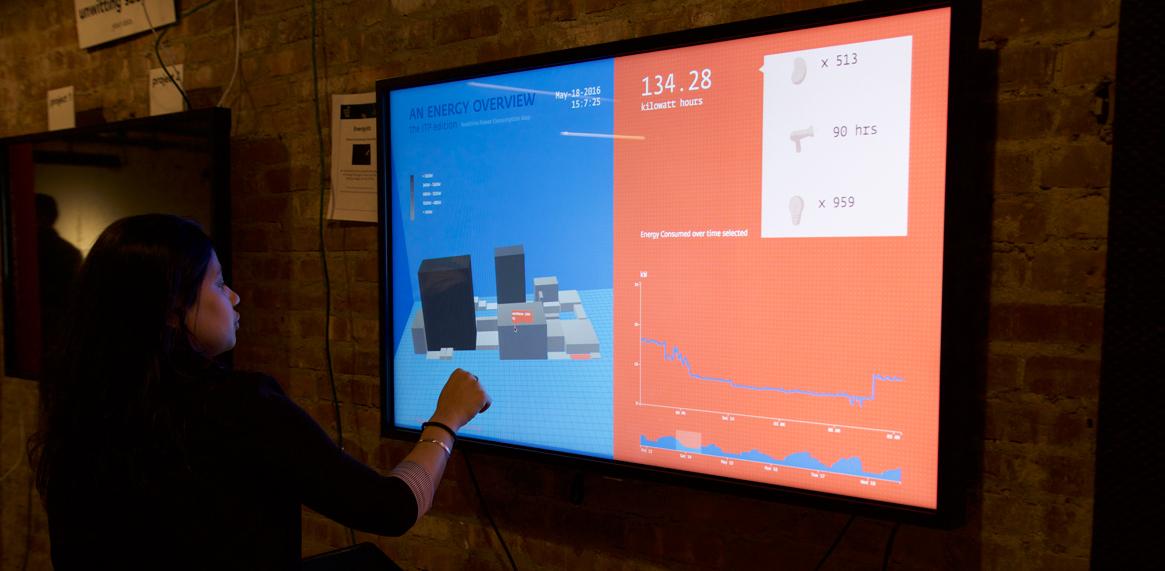
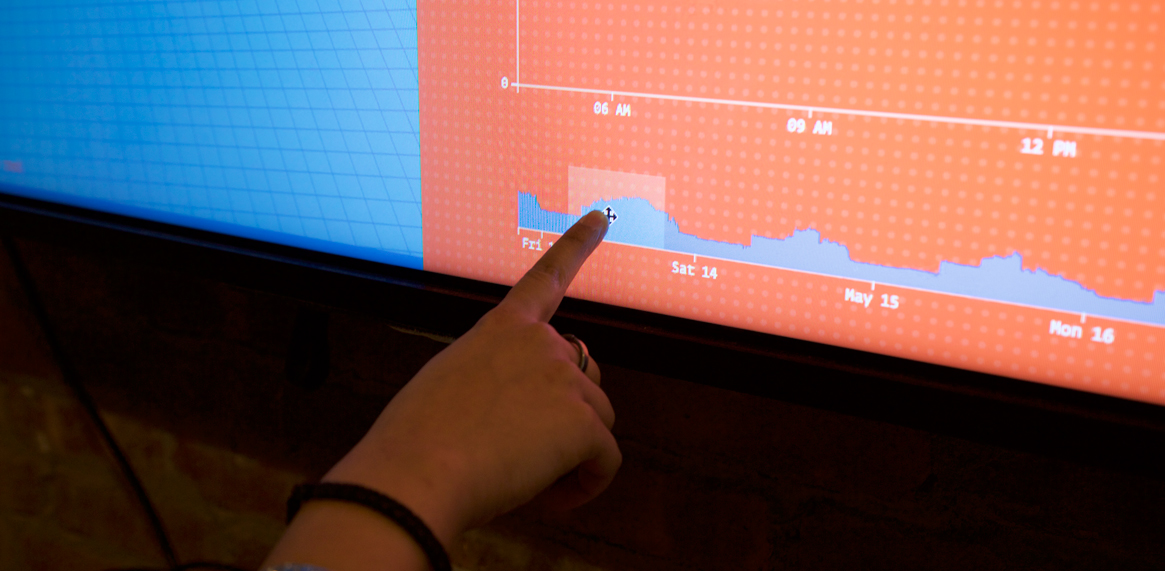
We built a dashboard that explains the energy consumption by the 4th Floor of Tisch School of the Arts, both in real time and over the past week.
A project initiated by Mathura Govindarajan and I, this grew into a research group at ITP called ITPower. The group now operates with 4 student members and 2 research residents along with our faculty advisor, Tom Igoe. We have hosted workshops, manually tested ITP's electrical circuits and designed strategies to create awareness around responsible energy behavior.
Objectives :
1. To bring the community closer to understanding the scale of the energy they consume.
Behavior change ( Long Term ) – Visualizing the energy consumed over longer periods of time in a more ‘human’ way, will make users aware of their energy footprint, urging a more conscious usage behavior.
Actionable item ( Immediate ) – The realtime power consumption of an equipment will let the user know what equipment are being turned on unnecessarily, offering an immediate actionable task – to turn them off.
2. Solicit behavior change through providing information and facilitate energy analysis of their individual devices.
Offer a space for users to “Plug in Their Own Devices”. This feature will give the user a better understanding of the equipment they engage with on a daily basis – allowing them to be able to compare and analyze this information.
Offer a space for users to “Plug in Their Own Devices”. This feature will give the user a better understanding of the equipment they engage with on a daily basis – allowing them to be able to compare and analyze this information.

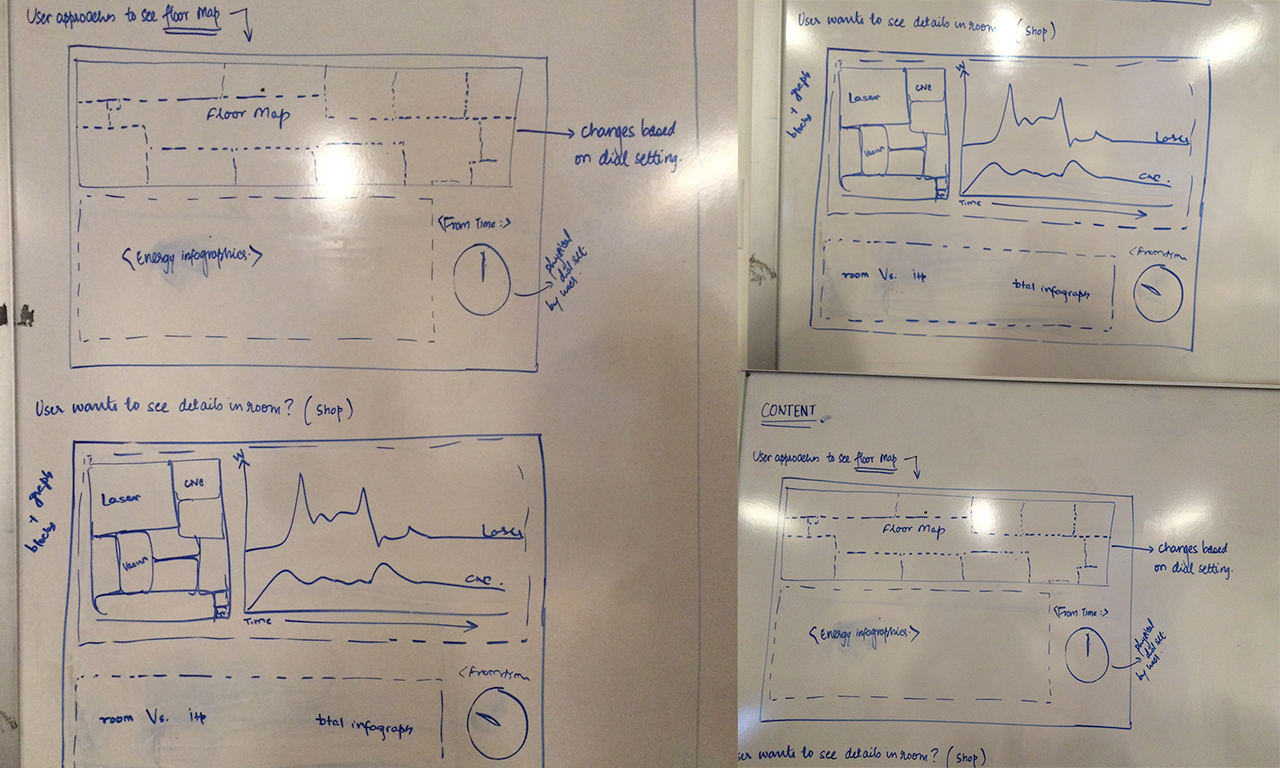
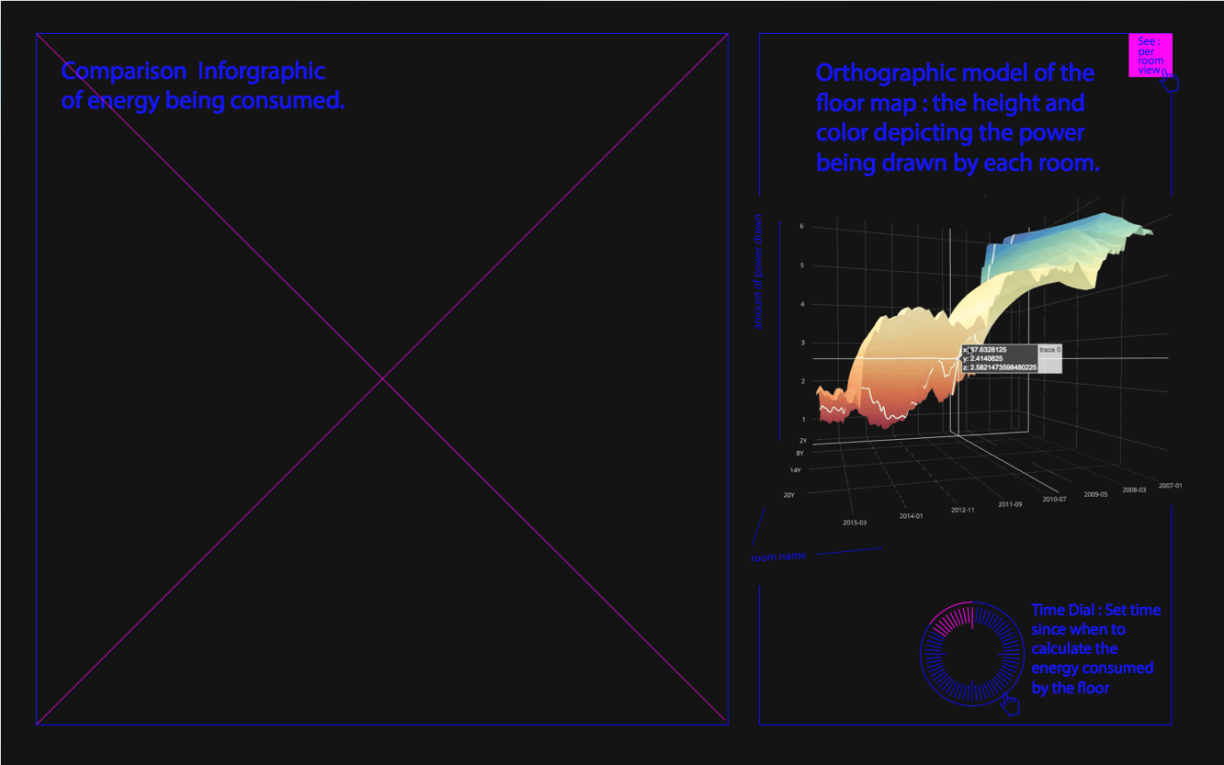
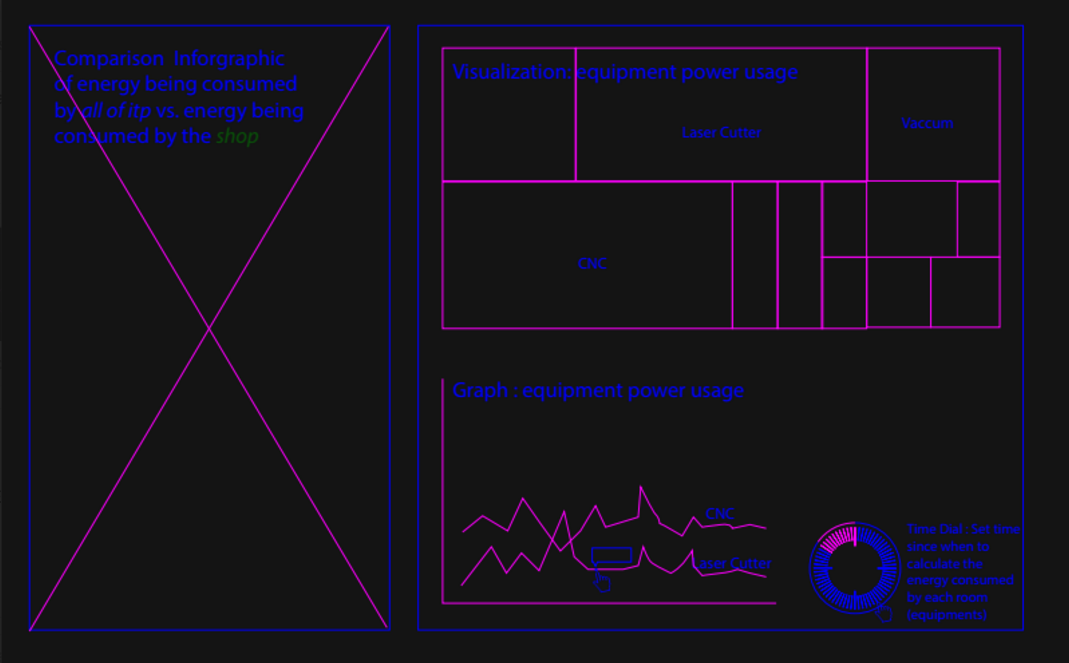
Wireframes: The wireframes show two screens. The first, that shows an aggregate power consumption ans the second one, to show room-wise equipment information.
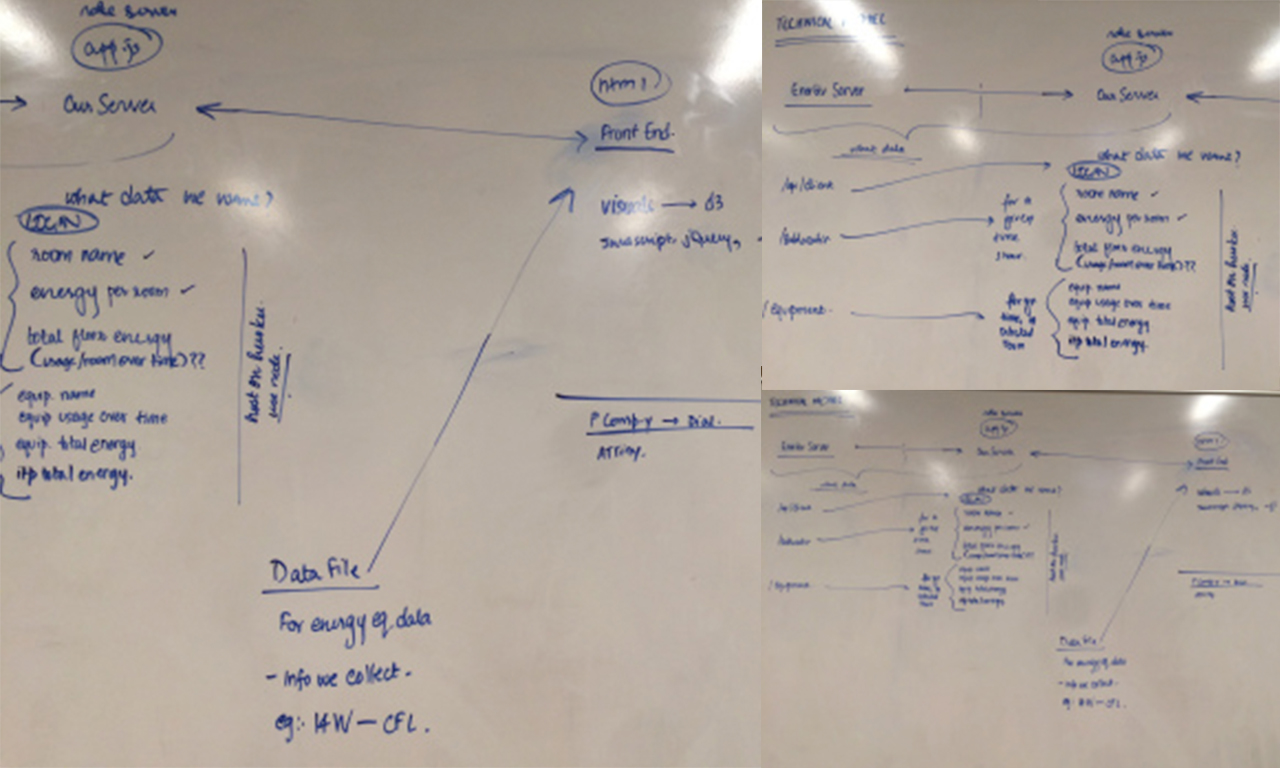
Technical Model: The main crux of the technical model can be divided into front and back end and the dial. The front end in implemented in d3.js + Three.js. For the back end, we created our own server that serves up data from enertiv given a time range and location/equipment.
Below is our first functional prototype of the webpage that gets in the overall power consumption data and also the data for each equipment in the room.


Project: Supported by NYU ITP
Role: Concept, Research, UX Research, UI Design, Visual Design, Information Design
Collaborators: Mathura Govindarajan, Yining Shi, Jingwen Zhu, Jenny Lim, Stephanie Koltun